BWA-MEM vs Minimap2: WGS somatic variant calling
We evaluated WGS somatic variant calling from alignment data by two aligners: Minimap2 and BWA-MEM. Our goal was to understand if we can replace slower BWA-MEM with Minimap2 in our cancer variant calling analysis pipleine in UMCCR.
We downloaded 2 datasets with curated somatic variants:
- ICGC medulloblastoma. Tumor: 103x, normal: 89x (downsampled from tumor: 314x, normal: 272x).
- COLO829 metastatic melanoma cell line. Tumor: 81x, normal: 79x
And we ran bcbio-nextgen with 3 variant callers:
- Strelka2
- VarDict (variant filtering http://bcb.io/2016/04/04/vardict-filtering/, allele frequency threshold is set to 10% to avoid excessive false positive rates and runtimes).
- Mutect2
- Ensemble calls (variant detected by 2 of 3 callers above)
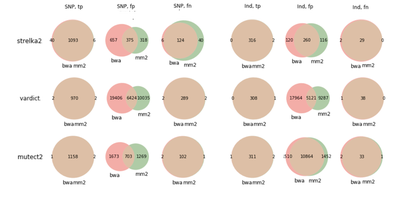
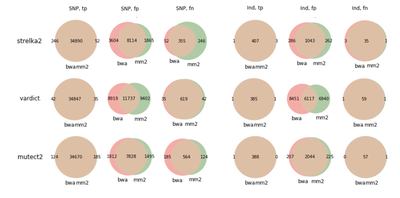
It appears that with Minimap2, all callers result in pretty similar performance comparing to BWA-MEM, with recall rate being even higher. And even though it looks pretty safe to migrate to Minimap2, we noticed that Strelka2 falls a bit short in precision in SNP.
ICGC medulloblastoma
COLO829
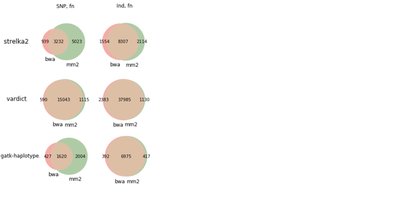
We also did run evaluation for GiaB NA12878 germline calls, and same pattern appeared there - Strelka2 shows a bit lower precision rate for SNPs.
The whole analysis was done in this Jupyter notebook; here we put few findings relevant to Strelka2.
We guessed that Strelka2 might be making some assumptions based on some BWA-MEM features for SNP calling, e.g. SAM tag values, that might be reported differently in Minimap2, with other callers ignoring those features.
All 40 false negative SNPs from the MB study were rejected by Strelka2 as having a LowEVS. From 246 COLO false negative SNPs, 15 were not detected, and the rest rejected with LowEVS. We tried to see if there are any significant alignment differences in those sites, like in the coverage depth, mapping quality, alignment score, etc. We counted average VCF and SAM tag values.
Average stats for all Strelka calls:
                Missed by Strelka2+MM2           Cought by Strelka2 with MM2 and BWA
                MB              COLO             MB             COLO
                BWA    MM2      BWA    MM2       BWA   MM2      BWA    MM2
SAM-AS          100.59 201.85   101.84 204.76    99.03 198.67   106.25 212.94
SAM-XS           34.58 .         91.15 .         27.34  .        29.96   .
SAM-NM            0.49 0.47       1.62 1.59       0.82  0.80      1.12   1.10
SAM-MQ           58.74 57.54     34.99 30.07     59.76 58.88     58.73  58.31
VCF-MQ           59.02 58.02     38.92 36.86     59.85 59.29     59.04  58.83
VCF-MQ0           0.40 0.30      29.97 21.35      0.07  0.05      0.82   0.72
VCF-AF            0.07 0.06       0.55 0.56       0.38  0.38      0.78   0.78
VCF-DP          103.83 101.00    58.39 37.56     80.12 79.29     91.18  90.22
ReadPosRankSum   -0.15 -0.12     -0.22 -0.14      0.06  0.05     -0.18  -0.18
SomaticEVS        9.38 6.02       9.67 5.84      18.21 16.45     18.70  17.20
As expected for false negatives, BWA-MEM’s EVS is quite higher than Minimap’s. It’s also slightly higher as well for false positives. DP and VCF-MQ are a bit higher too for MB, and DP and SAM-MQ appear to be especially larger for FN in the COLO study. For some reason, AS is consistently exactly twice higher for Minimap2 at all variants, wondering if it anyhow might affect EVS? One more difference is Minimap2 missing the XS tag.
Another curious observation is that the MB failed calls are all of quite low AF, unlike those for COLO which seem to have evenly distributed AFs:
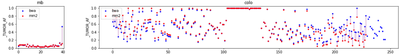
Eyeballing some variants, e.g. 1:50,854,774 from MB, it’s interesting that EVS is twice as high, even though the rest of the tags are very close: both SAM and VCF MQ values are 59.89 vs. 58.84, DP 74 vs. 72, Allelic depth is 6 for both calls, ReadPosRankSum is close to 0 for both. However, SomaticEVS differs quite a lot (12.82 vs. 6.77):
1 50854774 . T C . PASS AC=1;AF=0.25;AN=4;DP=159;MQ=59.89;MQ0=0;NT=ref;QSS=75;QSS_NT=75;ReadPosRankSum=-0.14;SGT=TT->CT;SNVSB=0;SOMATIC;SomaticEVS=12.82;TQSS=1;TQSS_NT=1;ANN=C|intergenic_region|MODIFIER|RP11-183G22.1-HMGB1P45|ENSG00000234080-ENSG00000229316|intergenic_region|ENSG00000234080-ENSG00000229316|||n.50854774T>C|||||| GT:AU:CU:DP:FDP:GU:SDP:SUBDP:TU 0/0:0,0:0,0:78:0:0,0:0:0:78,82 0/1:0,0:6,6:74:0:0,0:0:0:68,71
1 50854774 . T C . LowEVS AC=1;AF=0.25;AN=4;DP=158;MQ=58.84;MQ0=0;NT=ref;QSS=75;QSS_NT=75;ReadPosRankSum=-0.03;SGT=TT->CT;SNVSB=0;SOMATIC;SomaticEVS=6.77;TQSS=1;TQSS_NT=1;ANN=C|intergenic_region|MODIFIER|RP11-183G22.1-HMGB1P45|ENSG00000234080-ENSG00000229316|intergenic_region|ENSG00000234080-ENSG00000229316|||n.50854774T>C||||||;TUMOR_AF=0.0833333333333;NORMAL_AF=0.0;TUMOR_DP=72;NORMAL_DP=77;TUMOR_MQ=58.84000015258789 GT:AU:CU:DP:FDP:GU:SDP:SUBDP:TU 0/0:0,0:0,0:77:0:0,0:0:0:77,82 0/1:0,0:6,6:72:0:0,0:0:0:66,70
That variant was cought by Mutect2 and VarDict for both BWA and Minimap2. That does seem to be a pattern for both datasets: most of Strelka2 FN were cought by both Mutect2 and VarDict (consistently in BWA and Minimap2 case).
In general, even though showing a lower performance than Strelka2, VarDict and Mutect2 seem to be stable when switching between the aligners.
Interestingly, of 40 MB SNPs, 2 were actually called by Strelka2 with a different ALT. For 12:38153362, the correct alelle is T>C which was called with BWA by all callers, and with Minimap2 with VarDict and Mutect2; however Strelka2 reported T>G with Minimap2 here:
COLO BWA, strelka2:
12        38153362    .    T    C    .    PASS    AC=1;AF=0.25;AN=4;DP=343;MQ=42.98;MQ0=58;NT=ref;QSS=142;QSS_NT=142;ReadPosRankSum=-0.47;SGT=TT->CT;SNVSB=0;SOMATIC;SomaticEVS=11.33;TQSS=2;TQSS_NT=2;ANN=C|intergenic_region|MODIFIER|RP11-125N22.2-RP11-297L6.2|ENSG00000258368-ENSG00000257173|intergenic_region|ENSG00000258368-ENSG00000257173|||n.38153362T>C||||||
        GT:  AU:  CU:    DP: FDP: GU:   SDP:SUBDP: TU
Normal: 0/0: 0,0: 0,0:   82: 2:   0,9:  0:0:       80,146
Tumor:  0/1: 0,0: 33,33: 89: 0:   0,13: 0:0:       56,142
COLO minimap2, strelka2:
12        38153362    .    T    G    .    PASS    AC=1;AF=0.25;AN=4;DP=297;MQ=45.74;MQ0=11;NT=ref;QSS=112;QSS_NT=112;ReadPosRankSum=-0.47;SGT=TT->GT;SNVSB=0;SOMATIC;SomaticEVS=12.83;TQSS=2;TQSS_NT=2;ANN=G|intergenic_region|MODIFIER|RP11-125N22.2-RP11-297L6.2|ENSG00000258368-ENSG00000257173|intergenic_region|ENSG00000258368-ENSG00000257173|||n.38153362T>G||||||
        GT:  AU:  CU:    DP: FDP: GU:   SDP:SUBDP: TU
Normal: 0/0: 0,1: 0,0:   82: 1:   0,26: 0:0:       81,113
Tumor:  0/1: 0,3: 33,33: 89: 0:   0,36: 0:0:       56,85
Even though the 1st-tier allelic depth for G is 0, the variant was called as T>G.
We are wondering if in general, the discrepancy for Strelka2 comes from the alignment decisions Minimap2 makes differently from BWA (leading to diffences in coverage and reads aligner), or it might have to do with different ways to calculate and report particular SAM tags (like AS, XS)? If Strelka2’s model were trained with Minimap2 data, would it improve the performance, or it has to do with Minimap2 beeing less accurate than BWA-MEM? We would be happy to share any data and the details of the runs.